A True Understanding of R-X Diagrams and Impedance Relay Characteristics
ABSTRACT
This paper discusses 10 myths or common misunderstandings about R-X diagrams and impedance relay characteristics. Diagrams generated by computer simulations with actual examples are provided to dispel each myth. Understanding why these myths are not true and what the actual relay behavior is, will help test technicians to perform tests which correctly simulate real-world conditions, properly interpret test results and troubleshoot impedance relay problems when results are not as expected.
INTRODUCTION
Knowledge of true protective relay characteristics has not been communicated fully and properly from protective relay designers and protection engineers, to field test technicians. As a result, many misunderstandings about R-X diagrams and impedance relay characteristics are widely held. In turn, this leads to either incorrect testing of these devices or incorrect interpretation of the test results and how they relate to the real-world performance.
THE 10 MYTHS
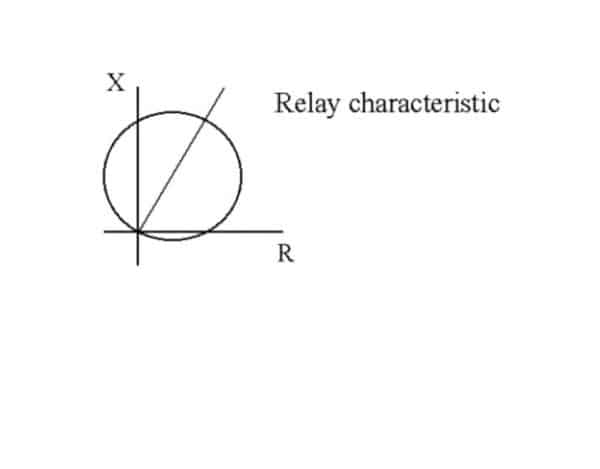
MYTH #1: A mho impedance relay generally has an operating characteristic which is a circle passing through the origin.
Figure 1.
Actually, all modern mho impedance relays for phase, ground and 3-phase protection have an expanded characteristic that includes the origin. This, of course, has been presented and discussed many times in different papers. (Ref. 1,5,6) The amount of the expansion depends on the element design, but is generally proportional to the source impedance of the system (Ref 1,5).
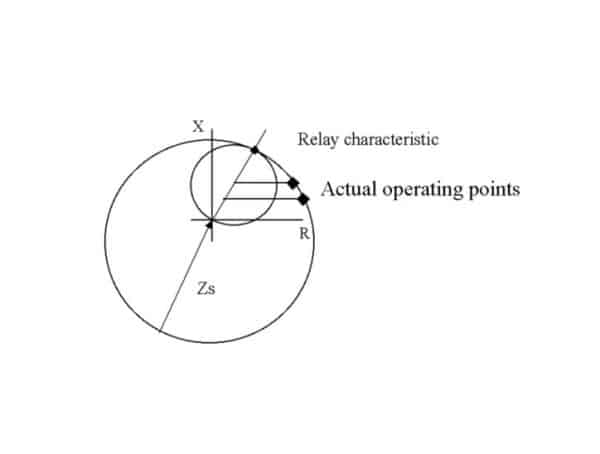
Figure 2.
Only the case in which the mho characteristic does pass through the origin is when the source impedance (Zs) is zero. However, this case would never happen since all real-world sources have some finite non-zero impedance.
So, where is the expanded characteristic hiding? Why don’t we see it when the relay is tested? What most people don’t realize is that even though the source impedance is not set on their test source, there is a source impedance presented to the relay. The simple explanation is that the relay sees the source impedance from the drop in the voltage from prefault conditions during the fault.
It has been shown (Ref. 2) that traditional fixed voltage or fixed current testing methods actually present a power system to the relay has the following special characteristics:
- It is a radial system (no load).
- The zero sequence source impedance is equal to the positive sequence source impedance.
- The angle of the zero sequence line impedance is equal to the angle of the positive sequence line impedance.
- The angle of the fault is equal to the line impedance angle and to the source impedance angle.
Of course, none of these are true in the real world.
When a test of the relay characteristic is done under these conditions, however, we find that a different power system model is presented to the relay for each test point, thereby plotting a point on a different expanded characteristic for each point. (Ref. 2) Because of the nature of the expanding characteristic, the combined test results show a mho characteristic, which passes through the origin.
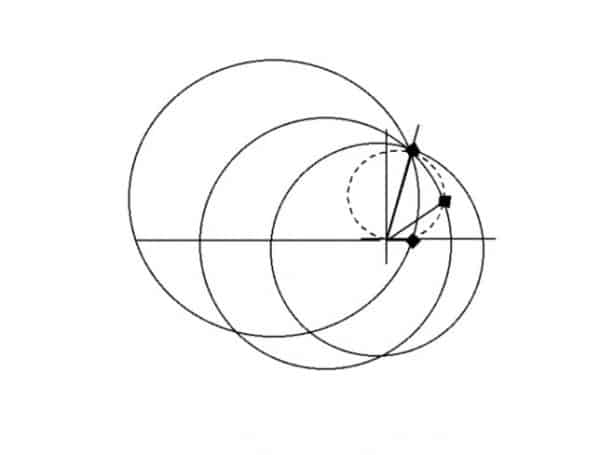
Figure 3. Combined Results
In order to reveal the true expanded characteristic, each test point must be performed simulating the same power system model and only changing the fault condition. This requires complex fault calculations and can only be performed practically with computer-aided testing (Ref. 4).
So what source should be used to verify the performance of the relay? Source impedance at a particular point will change depending on system conditions. Also, real impedance operate times actually vary with source to line impedance ratio (SIR). Generally, the operation times are higher with higher source to line impedance ratio values.
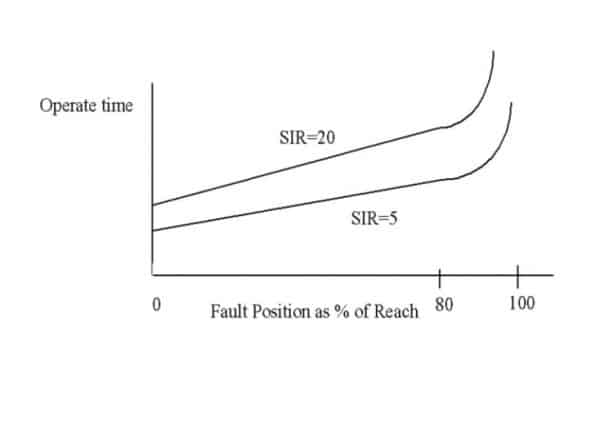
Figure 4. Typical Variation of Operate Time for Different SIR Values
Ideally one should test at maximum and minimum expected source impedance to get a total picture. If we test at the maximum expected source impedance, this will determine the worst case operate times. This will also allow us to confirm that load encroachment is not a problem for phase and 3-phase elements. However, be aware that there may also be situations in communication-aided tripping schemes where the minimum expected operate time is of significance because of possible race conditions.
MYTH #2: Points above the directional line represent forward direction faults and points below the directional line represent reverse direction faults.
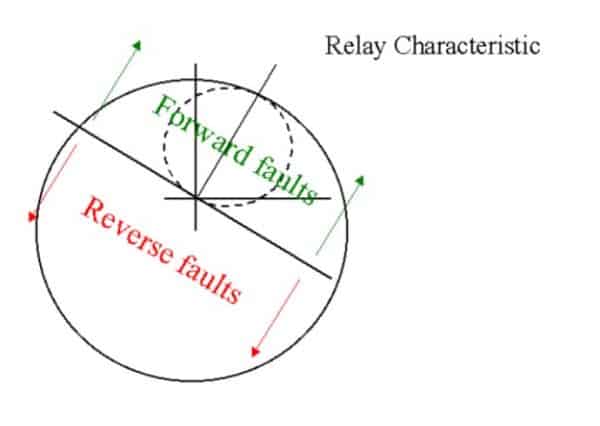
Figure 5.
The confusion here is that there are actually two quite different R-X diagrams used:
- A conceptual Z-plane graph showing one or multiple relay characteristics.
- A relay operating characteristic graph.
On both types of graphs, points are plotted by calculating the positive sequence impedance. On a conceptual z-plane graph, these points may be reverse faults or forward faults. Forward faults such as a forward capacitive fault or a forward resistive fault under a high load transfer condition can appear below the “directional line” or the R-axis. Similarly, reverse faults can appear above the “directional line” or the R-axis. Therefore, the location of the point does not imply the direction or location of the fault.
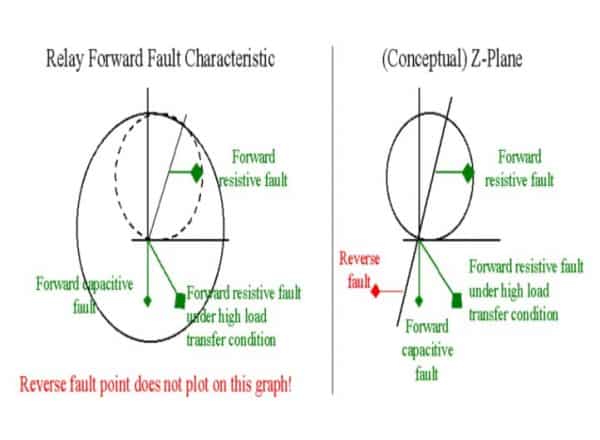
Figure 6.
A relay operating characteristic graph is shown either for forward faults or for reverse faults. On a relay forward fault characteristic graph, all plotted fault points are forward. Reverse fault points cannot appear at all on this graph.
The so-called “directional” or zero-torque line was used with old impedance relays that had a separate supervising directional element, or with directional overcurrent relays and incorrectly carried over to R-X graphs for modern relays. In fact, the directional line can neither be plotted on the relay forward fault characteristic nor the relay reverse fault characteristic graphs.
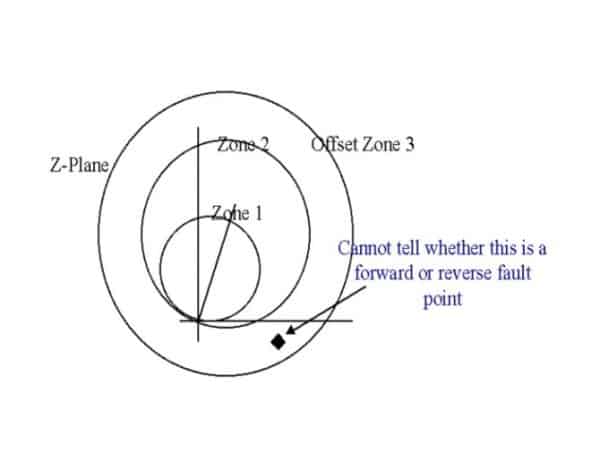
Very often we see diagrams such as the following showing multiple relay characteristics on a z-plane graph.
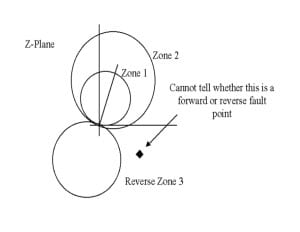
Figure 7.
We should keep in mind that these diagrams are conceptual. If we take any point on the graph and state that certain elements will or will not operate, this may be jumping to conclusions that may not be true.
What is misleading is that for the usual assumptions of radial homogeneous systems and simple faults, the theory that points above the directional line are forward faults and points below the directional line are reverse faults does hold up. However, real world scenarios do not fall into these simple cases. The actual characteristics must be plotted on separate graphs because the operating quantities used by these elements are different.
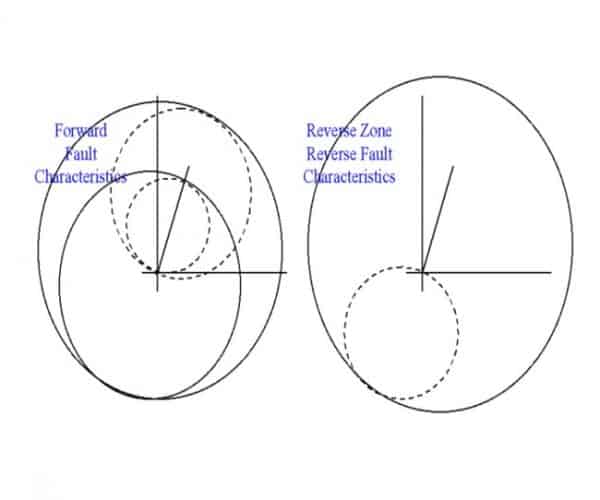
Figure 8.
Another dangerous graph is one of both offset and non-offset elements plotted together such as the following.
Figure 9.
The operating quantities used by the phase comparator in an offset mho element are different from those used in a non-offset mho element (Ref. 9). This type of diagram should be treated as conceptual.
Another illustrative example is the case of faults directly in front of and directly behind the relay. Both fault points plot on top of each other on a z-plane graph. The fault directly in front of the relay can only be plotted on the forward fault characteristic graph. The fault directly behind the relay can only be plotted on the reverse fault characteristic graph. The fault directly in front of the relay cannot be plotted on the reverse fault characteristic graph or vice versa.
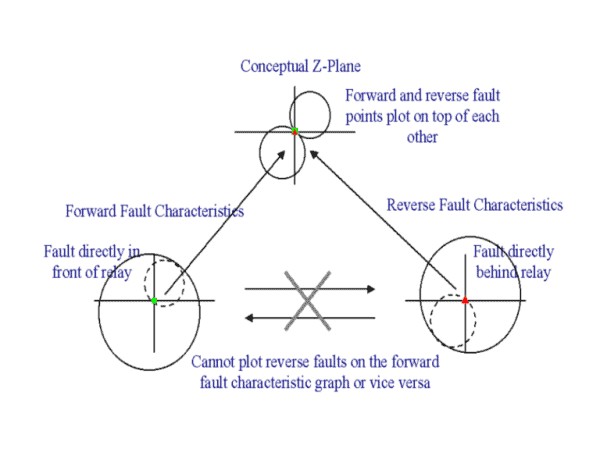
Figure 10.
MYTH #3: A mho impedance relay bases its operation by determining if the measured impedance is “geometrically” inside its characteristic on the Z-plane.
The geometric comparison analogy is used to simplify the explanation of the operating principle. Unfortunately, the geometric analogy is too often taken literally.
False Example 1
In this first example, we have a 2-terminal system with unequal sources. The one of interest is the weak source with high source impedance. A fault in front of the relay may result in an impedance which satisfies the impedance conditions for operation, but the voltage at the relaying point is dragged down and the resulting fault current is below the current supervision level and the element does not operate. This is the common “weak infeed” scenario.
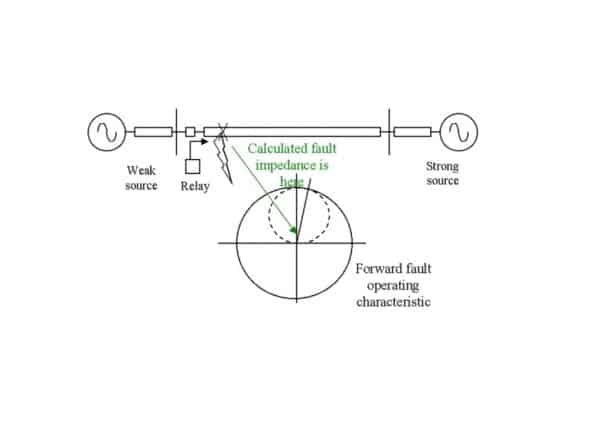
Figure 11.
False Example 2
In this second example, we have a series compensated line. There reverse fault directly after the capacitor is behind the relay of interest. The calculated impedance at the relaying point is inside the operating characteristic, but the relay does not operate.
The Z-plane graph is plotted using the faulted phase voltage, ignoring the unfaulted phase voltages. However, the relay uses the unfaulted phase voltages for directional comparison, thereby blocking operation for faults in the opposite direction.
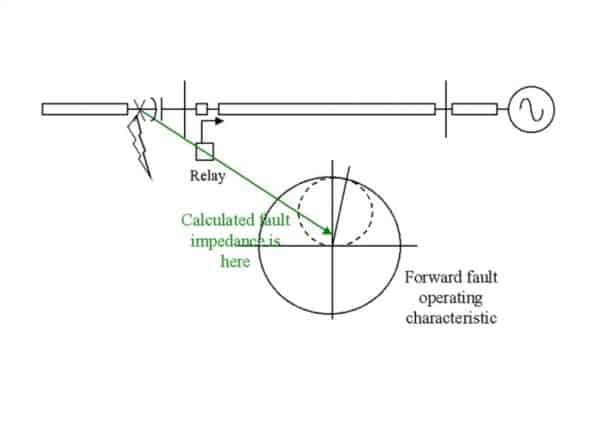
Figure 12.
False Example 3
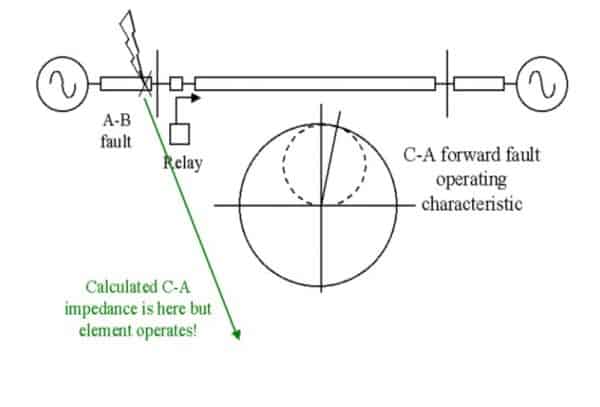
In this example, we have a 2-terminal system with some export load flow and an A-B fault behind the relay. The forward-looking C-A phase element uses minus IA in the operating quantity and compares against the phase angle of VB. The result is that the forward-looking C-A phase element can operate for this reverse fault, even though the calculated C-A impedance is well outside the mho characteristic on the R-X diagram.
Figure 13.
The truth is that mho impedance relays use a phase comparator between two carefully chosen complex quantities to make their operating decisions. Additional supervising elements can block operation, even though the impedance conditions are satisfied.
MYTH #4: Any point on the R-X plane can be simulated simply by applying the formulae:
For ground faults: complex Z= Va / (Ia + k Ir formula) (A-G case)
For phase faults: complex Z = Vab / ( Ia- Ib) (A-B case)
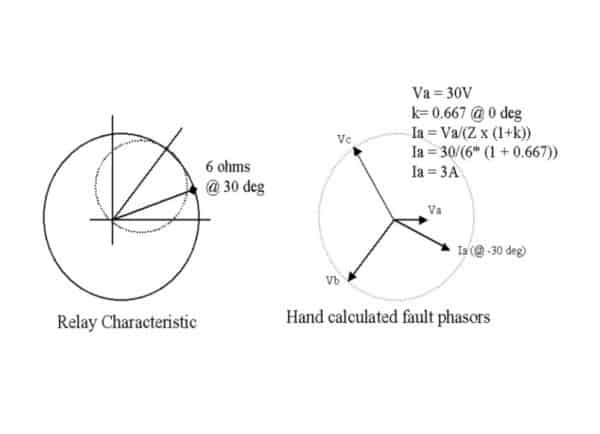
Figure 14. (A-G case)
In actual fact, the fault phasors for a typical system* would look quite different from the normal hand calculated values. Taking the A-G fault case, the fault phasors for a typical (radial) power system would look like the following:
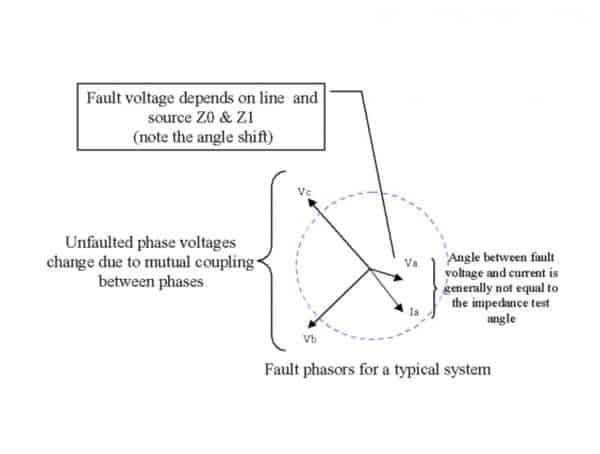
Figure 15.
* Although not realistic, a radial system is still used here for simplicity of explanation.
Note the following:
- The unfaulted phase voltages change. This is due to the mutual coupling between phases (Ref 8.).
- The angle of the faulted phase voltage (Va) shifts. The value of Va depends on the line and source positive as well as zero sequence impedances.
- The angle between the fault voltage and current is not necessarily equal to the impedance test angle.
In order to determine the appropriate voltages and currents to simulate a given fault condition, it is necessary to also decide on the power system being simulated. That is:
Fault condition + Power system — Determine -> Voltages & Currents
The power system is defined by:
The circuit configuration (radial, 2-terminal, parallel line etc.)
Source + line impedances (positive, negative and zero sequence)
Source voltages (magnitude and angle)
The fault condition is defined by:
Fault section (forward, reverse, adjacent line, beyond remote end)
Position (% of line)
Fault phase(s) and type
Fault impedance (magnitude & angle)
The relay input voltages and currents include:
Faulted phase voltage and currents
Unfaulted phase voltages and currents
(Prefault voltages and currents)
Without consciously deciding on power system, some arbitrary assumption must be made about either the voltage or the current or both and we end up with an unknown power system. (Ref Myth #1). Eg:
Fault condition + Power system — Determine -> Voltages & Currents
+ unknown power system
Of course, what an impedance relay does is use some knowledge (read assumption) of the power system which is the line impedances, and the voltages and currents to determine the fault condition. That is:
Fault condition <– Determine — Voltages & Currents
+ power system
Note that the voltages and currents include both the prefault and unfaulted phase voltages and currents.
In actuality:
- Any point on the R-X plane corresponds to an infinite number of possible fault conditions even for the same power system.
- Impedance relays use not only the faulted phase voltages and currents, but also the prefault and unfaulted phase voltages and currents to determine operation. All must be calculated properly with the same power system model that the relay is set for to simulate the desired fault condition.
MTYH #5: An impedance relay will only operate for faults in the direction it is set for.
In actual fact, the traditional forward-looking cross-polarized mho relay has an operating characteristic for reverse faults.
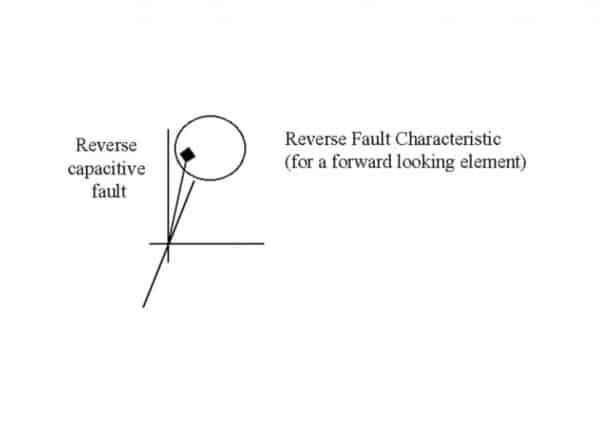
Figure 16.
Similarly, the traditional forward-looking quadrilateral element has an operating characteristic for reverse faults.
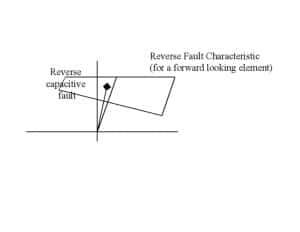
Figure 17.
Only if properly designed and applied will impedance relays not operate in the opposite direction that they are set for. Luckily, under most real-world conditions, the reverse fault characteristic will probably never operate.
MYTH #6: Fault resistance coverage varies greatly depending on load conditions due to mho load compensation.
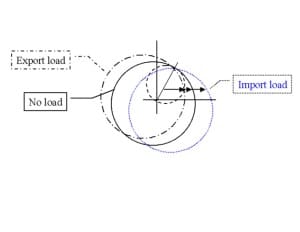
Figure 18.
This diagram is often shown illustrating the shift in the mho characteristic under different load conditions. (Ref 6). People incorrectly assume that the fault resistance coverage varies significantly under these varying conditions.
However, when we plot the fault position versus the actual fault resistance coverage for both the export load case and the import load case, we find that the fault resistance coverage varies very little.
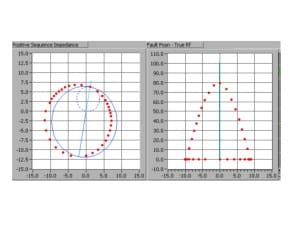
Figure 19. Export Load
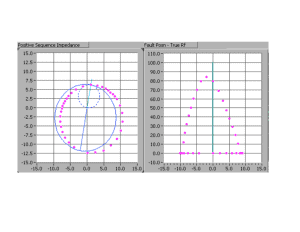
Figure 20. Import Load
The R-X graph shows an apparent impedance which has a complex relationship to the actual Rf depending on the power system conditions. The fault position vs. true Rf graph can remove all of those effects and show the true performance no matter what the power system conditions are. It is very useful for comparing performance under different operating conditions. Also, the capacitive faults at 0% are collapsed to the 0% line. Therefore, the graph doesn’t mislead us into thinking that the relay will operate for reverse faults (myth #2).
MYTH #7: A quadrilateral element guarantees constant fault resistance coverage.
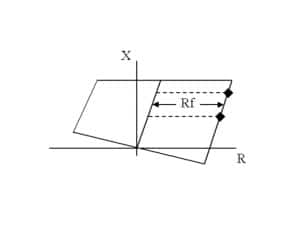
Figure 21.
In actual fact, most distance relay protections are applied to – terminal systems. In a 2-terminal system, the remote infeed has the effect of increasing the apparent fault resistance seen by the relay because the remote source contributes to the fault current, raising the voltage at the fault point and thereby decreasing the fault current from the measuring end.

Figure 22.
This is easily seen again when we plot the fault position vs. true Rf graphs for a 2-terminal system, and for a radial system for comparison purposes. We can see that in the 2-terminal case, the true Rf coverage decreases as the fault location is further. We can also see that the apparent R-X characteristic is the same as the radial case indicating that the relay response to apparent R-X is constant for the two cases.
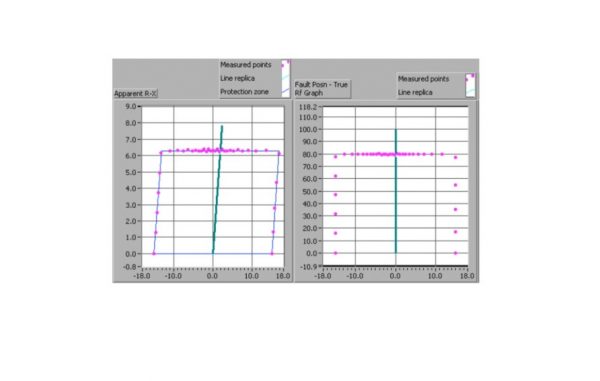
Figure 23. Radial System Case
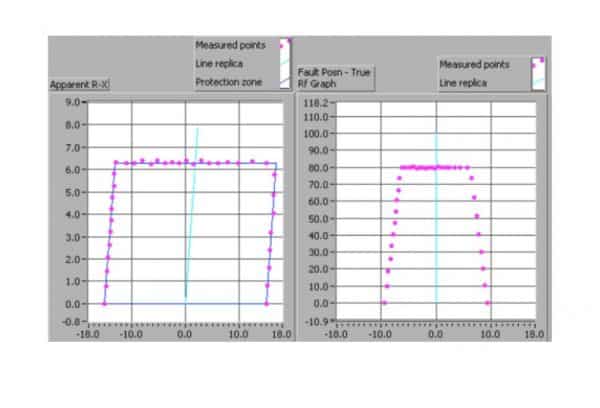
Figure 24. Two-Terminal System Case
Note that this trapezoidal characteristic is for a 2-terminal homogeneous system with no prefault load. We will see later what happens when this is not the case.
MYTH #8: A quadrilateral characteristic can be plotted together with a mho characteristic on the same impedance graph for comparison purposes.
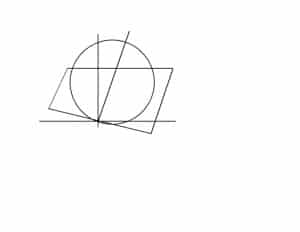
Figure 25.
This diagram is often seen and is very misleading. To understand why, let’s look at a simple example of an A-G fault with 10 ohms of fault resistance as seen by both a quadrilateral and a mho impedance element. Immediately we see that the resistive axis is different, because the apparent resistance seen by the quadrilateral element is 11 ohms, and the apparent resistance seen by the mho element is 7.3 ohms.
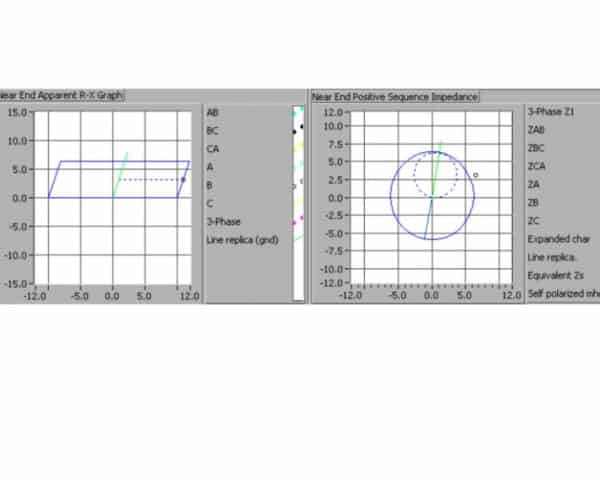
Figure 26.
A detailed analysis shows that the scales for the two types of graphs are actually quite different. Both types of graphs are of apparent impedance because the relays only have access to the voltages and currents at one terminal.
Graph type |
Horizontal Axis |
Vertical Axis |
Positive sequence Z(mho) |
Resistive part of the positive sequence impedance seen by the relay |
Reactive part of the positive sequence impedance seen by the relay |
Apparent R-X(quadrilateral) |
The resistive part of the line section from relay to the fault + apparent fault resistance (assuming a radial system and no load) |
The reactive part of the portion of the line from relay to the fault + apparent fault reactance (usually 0) |
On the positive sequence impedance graphs used to show mho elements:
- For ground faults, 1 ohm of fault resistance can map to a varying number of ohms horizontally depending on the k-factor. (The k-factor is the multiplier for the residual current to calculate. the phase voltage drop for a ground fault. It is usually expressed as a ratio of Z1 and depends on the mutual impedance coupling impedance between phases (Ref 8.).
- For phase faults, 1 ohm of fault resistance maps to 0.5 ohms horizontally.
(The above two statements are true only for a radial system.)
On apparent R-X graphs used to show quadrilateral elements:
- 1 ohm of fault resistance maps directly to 1 ohm horizontally for both ground and phase faults, assuming a radial system.
The y-axis values are equal to each other in the simple case of a homogenous radial system with pure resistive faults. However, this case is probably never encountered in the real world.
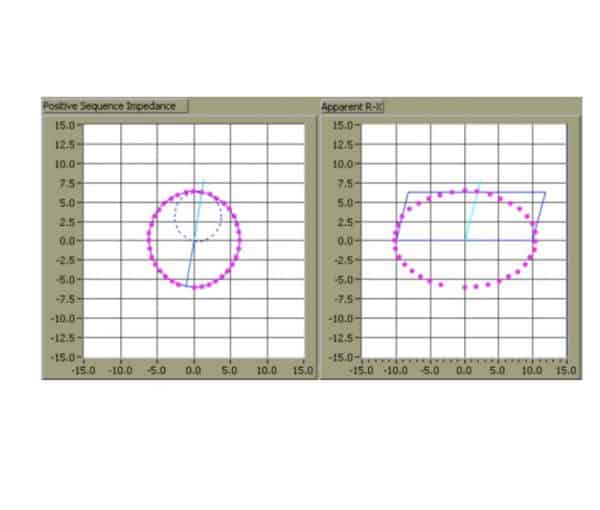
In actual fact, when a mho characteristic is plotted on an apparent R-X graph the shape looks like an oval.
Figure 27.
Note: The reference quadrilateral element in this figure was chosen to have the same resistive reach at 0% as the mho characteristic for illustrative purposes.
In order to properly compare the performance of a quadrilateral element to a mho element, we can again employ the fault position vs. true Rf graph. A typical result (for the same radial system) appears below:
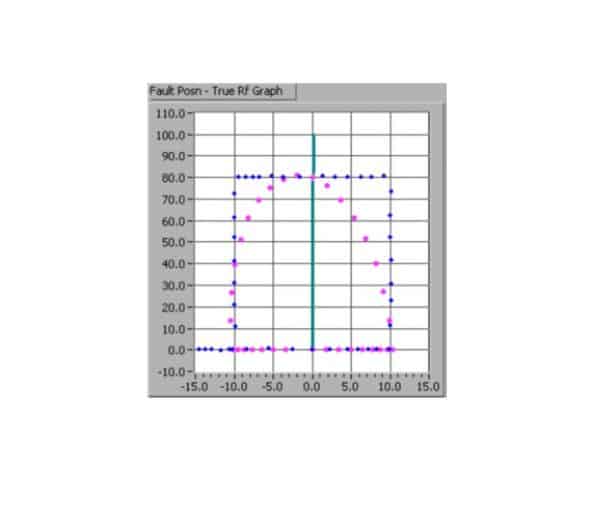
Figure 28.
MYTH #9: A quadrilateral characteristic can be drawn on an R-X diagram from a simple interpretation of the settings.
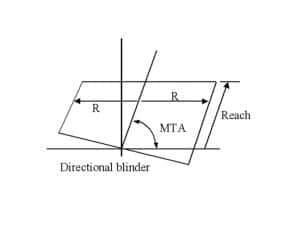
Figure 29.
Relay manufacturers have always drawn quadrilateral characteristics on R-X diagrams with some degree of generality and vagueness. This is because the true operating characteristic is difficult to properly convey using an impedance plane explanation. These diagrams are meant to be conceptual but often we try to take them literally.
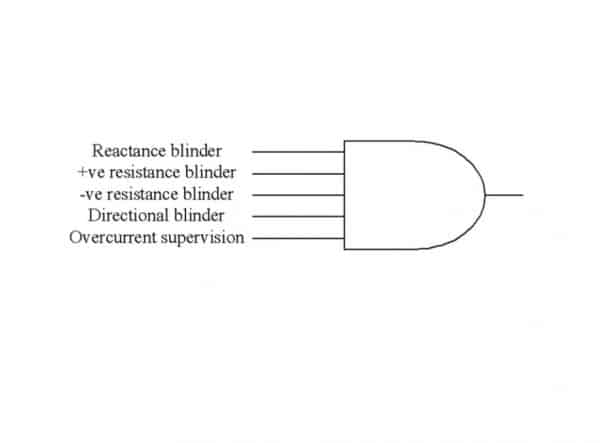
The actual implementation of a typical quadrilateral element is a composite AND of four blinder elements and an overcurrent element. Note that the last two elements are really not impedance measuring elements at all.
Figure 30.
The true operating characteristic for forward faults on an apparent R-X graph appears like this:
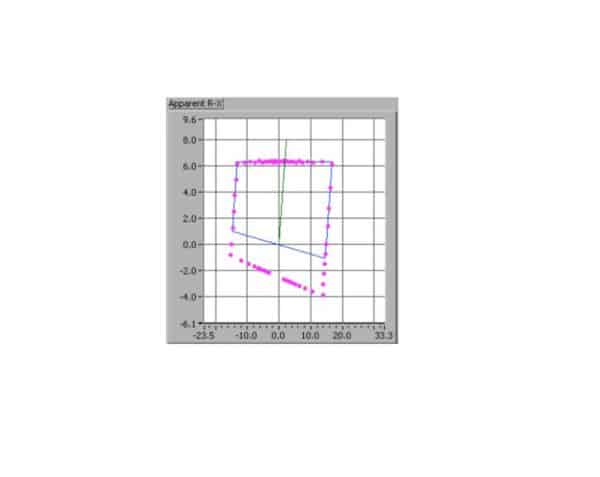
Figure 31.
A few points are of note:
- Most obvious is that the directional blinder line does not go through the origin. Remember that this means that the element will operate for forward capacitive faults at 0%. The mistake often made is that the directional blinder is tested using a traditional MTA type of test. Yes, if you do this you end up with a line going through the origin, but you would have simulated a different power system from the rest of the plotted points. (see Myth #1).
- Less obvious is that the line replica is not at the MTA angle on the graph. Different from the positive sequence impedance graph used for mho elements, the horizontal and vertical axes are not simply the real and imaginary parts of the same electrical quantity. The horizontal axes use the loop resistance (uncompensated) and the vertical axes use the positive sequence reactance (compensated) (See myth #8). The MTA angle setting of the relay corresponds to the positive sequence line angle.
- Depending on the design of the element, the resistive blinders may be parallel to the line replica or may be vertical constant resistance blinders (typically seen in European designs).
In most quadrilateral ground element designs, the resistance blinders operate using phase current, whereas the top reactance blinder operates on residual current. The latter causes a dynamic tilt in the reactance line on R-X or z-plane graphs and compensates for load flow. This also makes the characteristic difficult to properly illustrate the characteristic on a z-plane graph (Ref. 7) and again is a good reason to regard these diagrams as conceptual.
In some designs, you will see be a tilt or angle bias setting (Ref. 3) for the reactance line. This is to compensate for non-homogeneous systems where the angle of the line and source zero sequence impedances are not equal. Without the angle bias, we see the following, where there is an apparent overreach.
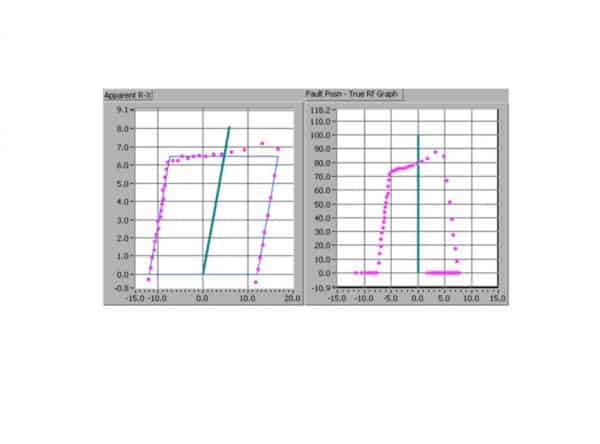
Figure 32.
By an appropriate angle bias setting, the reactance line can be tilted back to be more horizontal, resulting in the following:
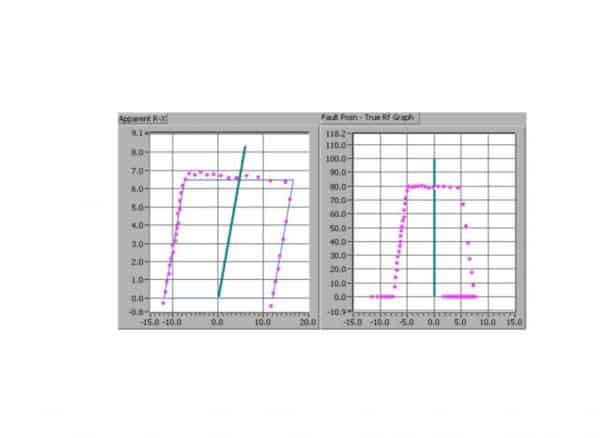
Figure 33.
There are many different variations of quadrilateral elements, and careful study of the manufacturer’s literature is required to properly understand their characteristics. The best tool for determining true performance is computer-driven test equipment using a true power system model with the results plotted on a “Fault position versus true Rf” graph.
MYTH #10: Impedance relays will not experience a fault condition with an apparent negative resistance fault in the real world.
False Example 1
One example of how this is not true is for simple phase faults. Take for example an A-B fault. A mho B-G element will see this fault as having negative fault resistance.
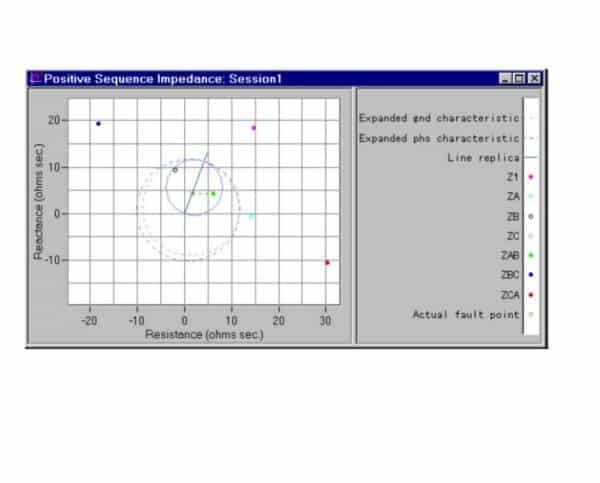
Figure 34.
False Example 2
Another example is a reverse direction resistive fault. A forward-looking impedance element will see these faults in the negative resistance half of the impedance plane.
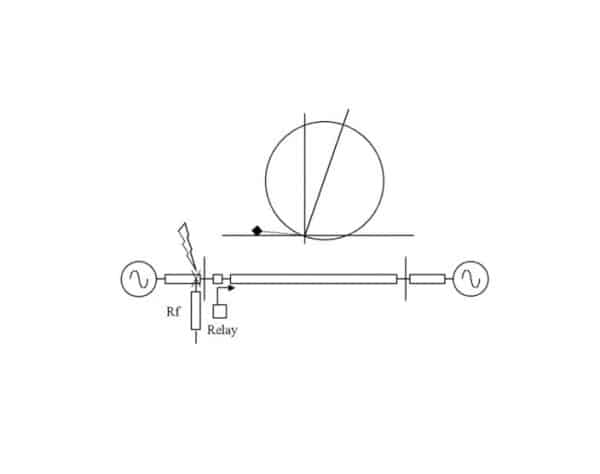
Figure 35.
False Example 3
A third example is in a 2-terminal system with a tapped load. An in section fault on the main line can also appear as negative resistance.
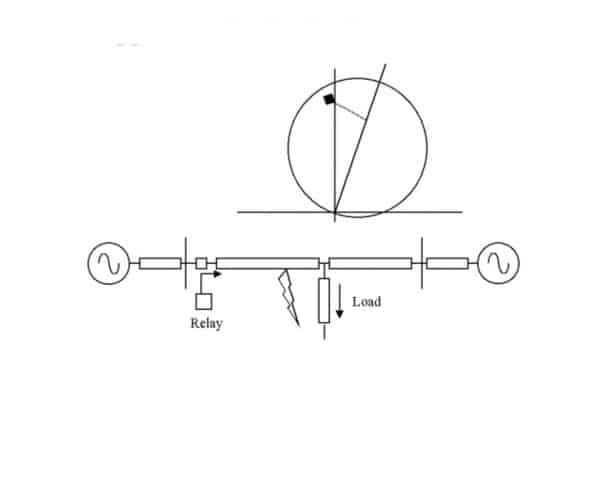
Figure 36
Therefore there are real-world conditions under which negative resistance can appear and this “half” of impedance relay characteristics are important to proper protection.
IMPORTANT TESTING IMPLICATIONS
Testing using traditional methods only checks the reach setting at MTA, and should not be interpreted by any means as the true performance of the relay.
Especially since:
Two terminal configurations are not tested
Load is not simulated
Source impedance is uncontrolled and unknown
Today’s power system operating environment is much more stringent than before, with narrowing security margins. Protection test procedures should be reviewed in this light and adverse or critical real-world conditions affecting protection should be identified and affected relays tested for their actual performance.
CONCLUSIONS
The key lessons learned in this paper are summarized as:
- Don’t misinterpret test results from traditional test methods as actual performance.
- Be aware of the different types of R-X diagrams used to depict impedance relay characteristics (conceptual z-plane graphs and actual forward or reverse fault operating characteristics).
- Don’t over-interpret relay element operation from z-plane graphs used to conceptually illustrate impedance element characteristics.
- Impedance relays use phase comparators for operation, not a geometric comparison.
- Real-world fault phasors can only be calculated using the power system parameters and fault conditions (prefault and unfaulted phase voltages and currents make a difference).
- Forward-looking elements can have a reverse fault operating characteristic and vice versa.
- Fault position vs. true Rf graphs help to depict true performance, independent of system conditions and protection design.
- Mho and quadrilateral characteristics make different apparent impedance measurements and should be plotted on separate impedance graphs.
- Quadrilateral characteristic settings don’t translate directly onto an apparent R-X graph.
- Real-world fault conditions can manifest themselves with negative fault resistance.
REFERENCES
-
E. Alexander, J.G. Andrichak, “Ground Distance Relaying: Problems and Principles”, Proceedings, 1991 Western Protective Relay Conference, Spokane, Washington.
-
T.Giuliante, “Re-engineering Relay Engineering”, Proceedings, 1997 Western Protective Relay Conference, Spokane, Washington.
-
GEC Measurements, Quadramho Distance Protection Relay, Instruction Manual, GEC Measurements, St. Leonards Works, Stafford, UK, 1988.
-
Manta Test Systems, MTS-2150 User’s Manual, 2002
-
J. Martilla, “Direction Characteristics of Distance Relay Mho Elements, Parts 1 & II”, IEEE Transactions on Power Apparatus & Systems, Vol PAS-100 No. 1, January 1981.
-
Price, “Testing Impedance Characteristics of Transmission Line Relays”, Proceedings, 53rd Annual Georgia Tech Protective Relay Conference, Atlanta, Georgia, 1999.
-
Ward, “Comparison of Quadrilateral and Mho Distance Characteristics”, Proceedings, 1999 Western Protective Relay Conference, Spokane, Washington.
-
Zocholl, “Three-Phase Circuit Analysis and the Mysterious k0 Factor”, Proceedings, 1995 Western Protective Relay Conference, Spokane, Washington.
-
Cook, “Analysis of Distance Protection”, Research Studies Press, 1985, England.
-
Tang, “Dynamic State and Other Advanced Testing Methods for Protection Relays Address Changing Industry Needs”, NETA World, Summer 2001.
APPENDIX
