SFRA Ratio – A Simple Test to Identify a Winding with Shorted Turns
SFRA testing is a powerful and sensitive method for assessing the mechanical and electrical integrity of transformer core/coil assemblies. The two most commonly used tests are the open-circuit and short-circuit tests. Both frequently have no difficulties detecting the presence of an electrical failure, with shorted turn(s) being one of them. Since windings are electromagnetically coupled, the SFRA trace obtained from one of the windings could be affected by the electrical failure on a different winding. Identifying which winding has the problem is always a challenging task. The SFRA ratio (a.k.a. the inductive inter-winding SFRA test) can help to solve this problem and has been successfully used by Doble clients since 2016.

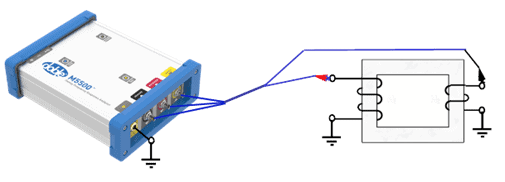
Figure 1. Basic Setup for SFRA Ratio Test
Fig. 1 shows the basic setup of the SFRA ratio test. The high-voltage winding is excited by the test voltage applied between the red lead and ground and the secondary voltage is measured between the black lead and ground. The ratio of voltages – calculated by Equation (1) – can be displayed as shown in Fig. 4 by selecting Plot Magnitude (ratio) as shown in Fig. 5.
![]()
1. Identifying winding with shorted turn
The ratio closely approximating the ratio of turns can be obtained only at the low frequency (< 200 Hz). The spread or maximum deviation (Δ) between the SFRA ratio traces of different phases is used in detecting the presence of the shorted turn and identifying the defective winding.
Table 1 presents the guidelines for analysis of the SFRA ratio at the frequency near 25 Hz (selected to avoid interference at power frequency).
- The trace of the phase that is abnormally low in comparison to traces of other phases is an indication of failure in the primary winding, i.e., the reduction of the number of turns N1 reduces the voltage ratio.
- The trace of the phase that is abnormally high in comparison to traces of other phases is an indication of failure in the secondary winding, i.e., the reduction of the number of turns N2 increases the voltage ratio.
Table 1. SFRA Ratio interpretation in low frequency region
| Lower – Fail | Normal – Pass | Higher – Fail | |
| %Δ25Hz | Abnormally how | Within limit | Abnormally high |
| Shorted turns location | V1 (Primary) winding or series winding | Normal condition | V2 (Secondary) winding or common winding |
2. SFRA Ratio Analysis in SFRA V6.2
SFRA ratio analysis has been implemented in SFRA version 6.2 since March 2022. The software automatically identifies the trace with abnormal deviation and points out which winding has the shorted turns. For example, a transformer rated 300 MVA, 230/20 kV tripped out of service and SFRA Open-Circuit (OC) tests identify a typical shorted turn defect in Phase A. This defect could be in either the HV winding (Fig. 2) or in the LV winding (Fig. 3).

Figure 2. SFRA HV Open-Circuit Test Results

Figure 3. SFRA LV Open-Circuit Test Results
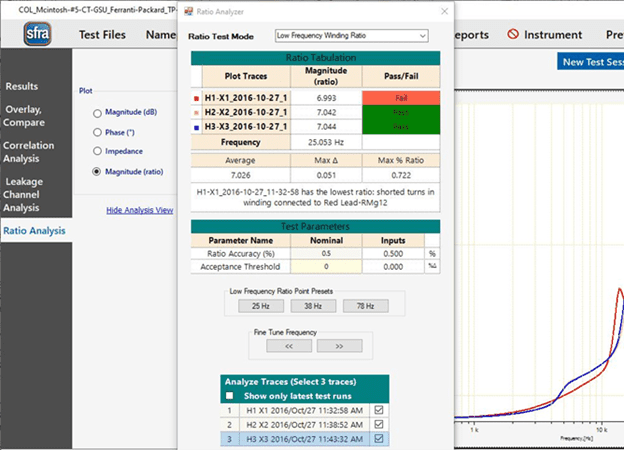
To determine which winding in the phase A had the shorted turns, the SFRA ratio tests were performed on all three phases (Fig. 4) and SFRA ratio analysis was used to automatically detect the defective phase A and identify the shorted turns located in H1 winding (Fig. 5).

Figure 4. SFRA Ratio Results

Figure 5. Ratio Analyzer window superimposed on result window
3. Summary
The field test experience above has demonstrated the value that the SFRA Ratio test can offer as additional information associated with the winding condition and help rapidly locate the defective winding that can guide further investigative actions. Furthermore, this test does not require any additional investment other than using the existing test set and if performed in junction with the standard SFRA tests, the time of both the test setup and performance of the test will be minimal.
More Information:
- Product:
- Articles:


