A More Refined Analysis, Better Results: A Look at the DTAWeb Bushing Analysis Tool
Most often, the limits employed in diagnostic analysis of high-voltage bushings rely on general rules and limits. They include comparison of test results with the nameplate and/or initially tested values, absolute limits, and trending of empirical data over time.
This approach, while useful, has some limitations. It relies on similar or the same limits being applied across different types of bushings, which may miss the early stages of deterioration that a refined model might detect. For example, an often used limit by some manufacturers for power factor values corrected to 20°C is two- or three-times the benchmark value. A limit for power factor of ≤ 0.5% is given in IEEE C57.19.01 for oil-impregnated paper-insulated bushings. For capacitance, a 5-10% increase/decrease in measured values over the benchmark value is used as action limits by some users. IEEE C57.19.01 has a limit for change in capacitance of ±1% based on the initial value.
The Tool for Refined Bushing Data Analysis
Doble’s Bushing Analysis Tool is available in the web version of the Doble Test Assistant (DTAWeb) application, which uses statistics to open the door for a significant enhancement of existing analysis. The tool is used to tailor limits by determining what is statistically normal for a specific type, manufacturer and voltage rating of a bushing. This is accomplished by having access to the Doble database of more than 3 million bushing test results. Specifically, the tool computes the deviations of power factor and capacitance from the nameplate or the first measurement for a particular population of specific bushings based on a DTAWeb query. It is followed by the determination of the probability distribution that best fits the selected test data. Once the data is characterized by probability, the limits can be applied by using common statistics deriving the mean and standard deviation. The Bushing Analysis Tool is useful for:
- Performing statistical comparison of the bushing under consideration to other bushings, both within your fleet as well as the entire Doble database
- Condition assessment for asset management
- Assisting in potentially identifying bushing problems that may go unnoticed with traditional approaches
- Data analysis in the event of an industry-wide bushing issue
The Bushing Analysis Tool in Action: A Case Study

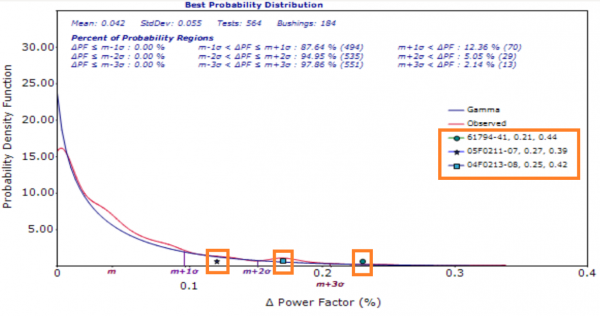
It is important to identify the bushings that behave differently in the same population. The figure above shows the probability density function for change in power factor of the C1 insulation for a specific population of bushings (same manufacturer, type and voltage rating). The red curve corresponds to the selected test data while the blue curve corresponds to the gamma distribution, which is automatically selected by the tool, in this case, as the best fit of the selected data behavior. Three bushings have been identified (see orange squares along the X-axis) as well as listed with their serial number, and first and last measurement results (see legend highlighted to the center-right). Clearly, the identified bushings, even though they might meet traditional limits, should be given special attention given the deviation from the bulk of this population. The probability of exceeding 3σ is 2.1%, 2σ – 5.0% and 1σ – 12.3% where σ is the standard deviation.
Interested in learning more?
- Browse our Webinars section for the latest online sessions discussing high-voltage testing.
- Are you a Doble Client? Contact your Client Service Engineer for more information.


